2021 Annual Summary Dashboard
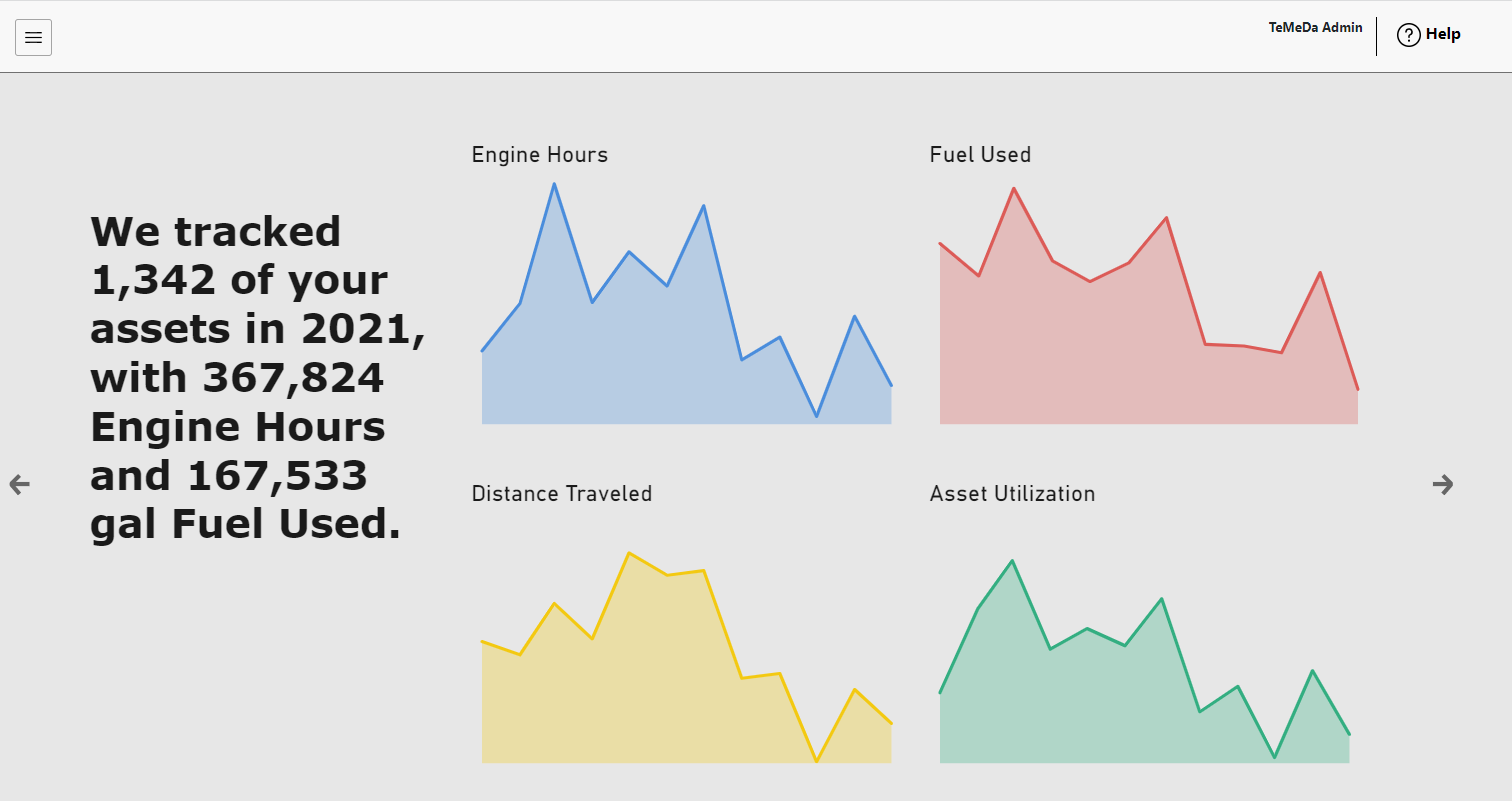
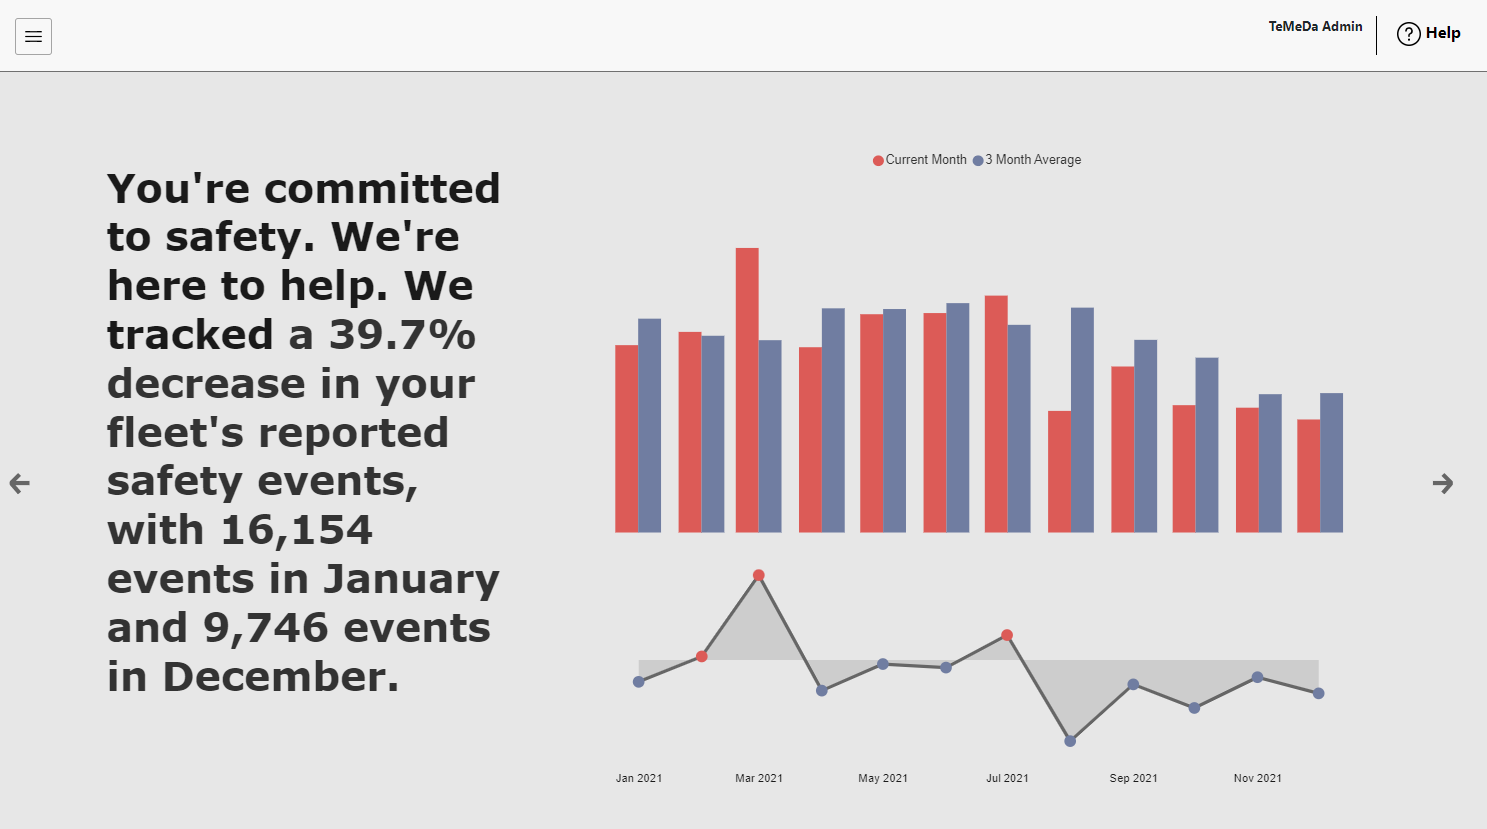
In Temeda platform v2.73 we’ve added a new 2021 Annual Summary dashboard. The new dashboard looks back at 2021 to review several key metrics for your organization. We’ve summed up your annual fuel usage, distance traveled, engine runtime, and utilization. We provide an overview of your top location and zone activity, alert trends, safety events, and top asset/vehicle/equipment usage.
To view your personalized 2021 Annual Summary Dashboard, click the Dashboard menu on the left navigation pane.
Wherever your fleet operates, Temeda is working with you to build your business. Temeda genuinely appreciates your business, and we’re grateful for the trust you’ve placed in us. Thank you.
2021 Annual Summary Dashboard

Annual KPI Summary

Annual Safety Event Summary

Annual Top Equipment KPIs

