
Release Contents
Fleet Overview Dashboard
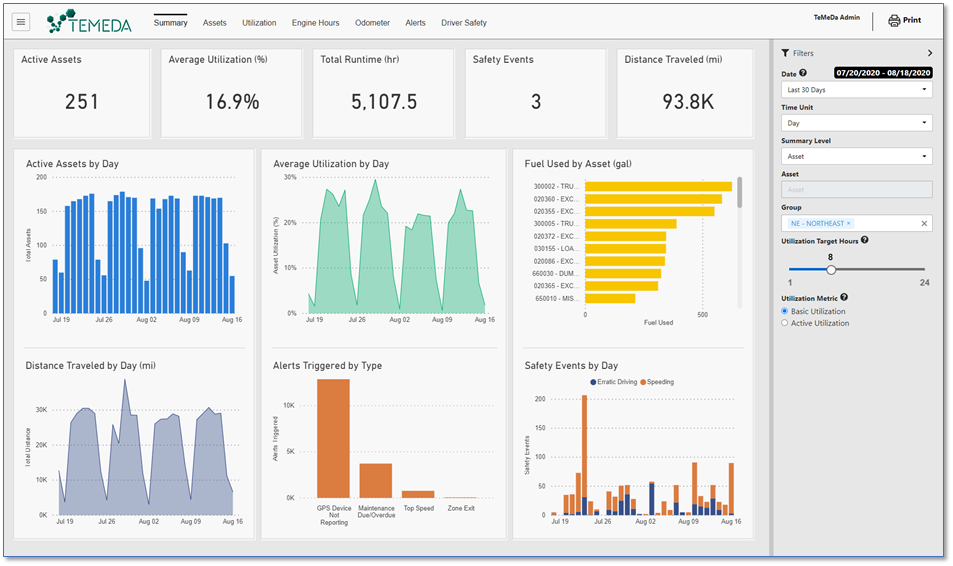
In Temeda Web Portal App v 2.52 we’ve added a new feature called Fleet Overview Dashboard. The Fleet Overview Dashboard provides a quick visualization of the key operating metrics for your entire fleet of tracked assets, machinery, and equipment. This information allows managers to get a big picture view of the organization against key metrics, identify trends, and see where improvements are needed to operate more effectively and enhance overall business performance.
The Fleet Overview Dashboard is made up of several key components including:
- Summary – Key metrics from each of the main components below.
- Assets – A breakdown of your equipment, types, and age.
- Utilization – A breakdown of actual engine runtime vs targeted runtime.
- Engine Hours – A breakdown for assets that capture engine runtime.
- Odometer – A breakdown for assets that capture driving distance.
- Alerts – A breakdown of all alert events triggered within your organization.
- Driver Safety – A breakdown of key driver safety alerts and events.
Filter Pane
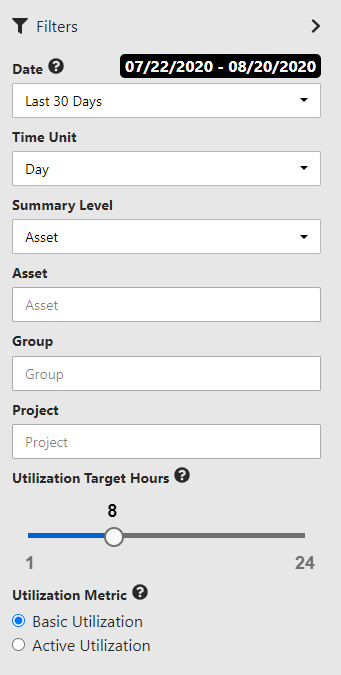
Use the Filter Pane to drill down, analyze, and explore your fleet data. Selections made on the filter pane will be reflected in each dashboard tab. Click the top right arrow to hide the filter pane for a full screen view of your dashboards.
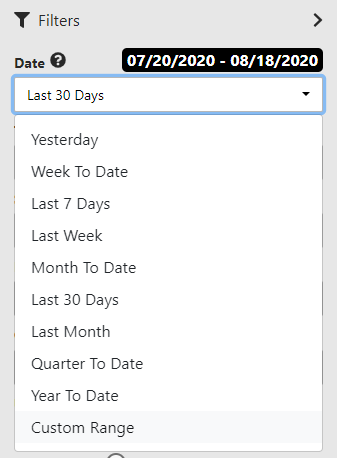
Date Filter: Choose a variety of pre-defined date ranges or use the Custom Range option to define the date range.
Note: All Date/Times in the dashboards are summarized by Day, Week, or Month using the Coordinated Universal Time or UTC time zone.
 |
 |
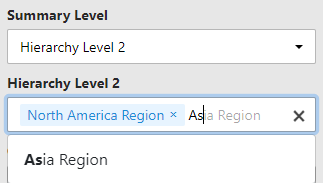
Summary Level Filter: Choose what you want to compare using the Summary Level filter, such as Make, Model, and Equipment Type. When choosing a Summary Level, additional filters will be made available in the box below, which allows you to choose one or more sub-filters based upon the Summary Level selected.
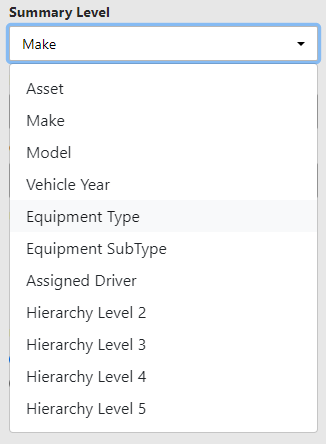
If you want to narrow what is being compared in the views further, you have the option of selecting from the Summary Level. This capability allows users to make side by side comparisons.
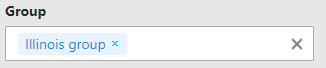
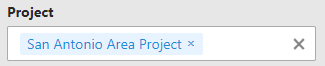
Furthermore, use the Groups and Projects filters to compare one or more Groups from within your account.
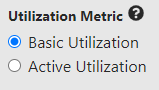
Utilization Metrics
Select a Utilization Metric by choosing Basic Utilization or Active Utilization. Changing the Utilization Metric will cause the utilization charts to refresh based upon the new metric. “Basic Utilization” includes all days, and “Active Utilization” only includes active days or days with Engine Runtime accumulation in the calculations for asset utilization.
 |
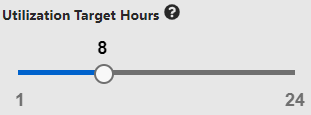 |
Slide the Utilization Target Hours to your desired target runtime hours per day. Sliding the target hours will cause the utilization charts to refresh based upon the new target hours.
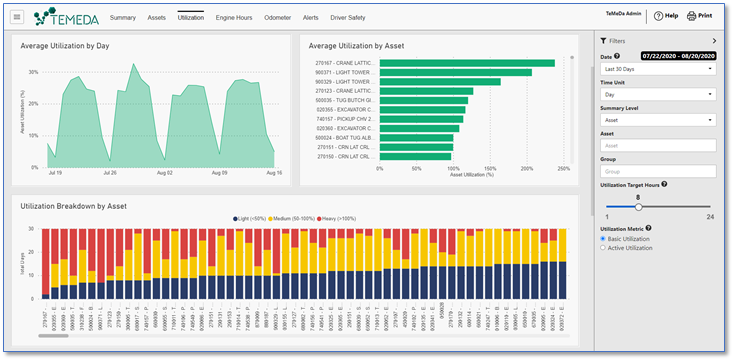
Chart Definitions:
Active Assets: The number of assets that have sent at least one engine or GPS location report in the selected date range (excluding Health reports).
Average Utilization %: The accumulated engine hours as a percentage of capacity hours. Capacity hours are determined based on the Utilization Target Hours per day, the number of dates in the selected date range, and the number of assets.
Basic Utilization: An equipment utilization metric which considers all assets reporting engine hours for all days in the selected date range. In this metric, the capacity hours for each asset are defined as:
Utilization = (Accumulated Engine Hours) / (Utilization Target Hours x # Days in Range)
Active Utilization: An equipment utilization metric which considers only active assets and active days (equipment that has reported engine runtime in the selected date range and only those active days). In this metric, the capacity hours for each asset are defined as:
Utilization = (Accumulated Engine Hours) / (Utilization Target Hours x # Active Days in Range)
Total Runtime: The accumulated engine hours for the selected date range.
Safety Events: The number of Driver Safety Events generated. Driver Safety Events are generated by device event codes (Speed Threshold, Harsh Acceleration, Harsh Braking, and Harsh Maneuver) and user-configured alerts (Speed Limit, Speed Threshold, Harsh Acceleration, Harsh Braking, Harsh Maneuver, Erratic Driving, Distracted Driving, Camera Shock, and Impact).
Distance Traveled: The accumulated distance based on odometer.
Average Odometer: The average of each vehicle’s lifetime odometer value.
Average Engine Hours: The average of each vehicle’s total engine hours value.
Average Age: The average of each vehicle’s age in years. Age is calculated in increments of days.
Assets with Engine Runtime: The number of assets which have accumulated engine hours.
Total Runtime: The accumulated engine hours.
Utilization Breakdown: A breakdown of the utilization of each asset by day. The chart shows the number of days each asset operated with Light Utilization (less than 50% of the Utilization Target Hours), Medium Utilization (50-100% of the Utilization Target Hours), or Heavy Utilization (more than 100% of the Utilization Target Hours).
Daily Runtime: The average accumulated engine hours per day over the selected date range. This is calculated as:
(Total Runtime) / (# Days in Range)
Fuel Used: The amount of fuel used in the selected date range.
Daily Fuel Used: The average fuel used per day over the selected date range. This is calculated as:
(Fuel Used) / (# Days in Range)
Fuel Economy: A measure of fuel efficiency based on travel distance and fuel used with units of miles per gallon or liters per 100 km. This is calculated as:
(Travel Distance) / (Fuel Used)
or (100 x Fuel Used) / (Travel Distance)
Assets with Travel Distance: The number of assets which have accumulated distance based on odometer.
Daily Distance: The average travel distance per day over the selected date range. This is calculated as:
(Distance Traveled) / (# Days in Range)
Assets with Alerts: The number of assets which have generated an alert over the selected date range.
Total Alerts: The number of alerts generated.
Critical Alerts: The number of critical, high-severity alerts generated.
Driver Safety Alerts: The number of driver safety alerts generated (e.g. Speed Limit, Speed Threshold, and Harsh Brake, Acceleration, Maneuver).
Idle Alerts: The number of idle alerts generated (e.g. Idle Occurrence and Idle Daily Limit).
Location Alerts: The number of location alerts generated (e.g. Location Stop, Location Entry, Location Exit, Time Exceeded within Location).
Maintenance Alerts: The number of maintenance alerts generated (e.g. Maintenance Due and Check Engine / Diagnostic).
Utilization Alerts: The number of alerts related to equipment usage (e.g. Ignition On/Engine Running, Movement Started, and Off Hours Usage).
Other Alerts: The number of alerts not falling into the Idle, Location, Maintenance, and Utilization categories.
Assets with Safety Events: The number of assets which have generated a driver safety event over the selected date range.
Safety Event Rate: A measure of the safety of operation for each asset with units of Safety Events per 100 miles/km. This is calculated as:
(100 x # Safety Events) / (Distance Traveled)
Speed Events: The number of driver safety events related to speeding (Speed Limit and Speed Threshold).
Erratic Driving Events: The number of driver safety events related to erratic driving or harsh maneuvers (Harsh Acceleration, Harsh Braking, Harsh Maneuver, Erratic Driving).
Shock Events: The number of driver safety events related to impact or collisions (Camera Shock, Severe Shock, and Impact).
Distracted Driving Events: The number of driver safety events related to distracted driver behavior.
Phone App: Maintenance Plans Add/Edit/Delete
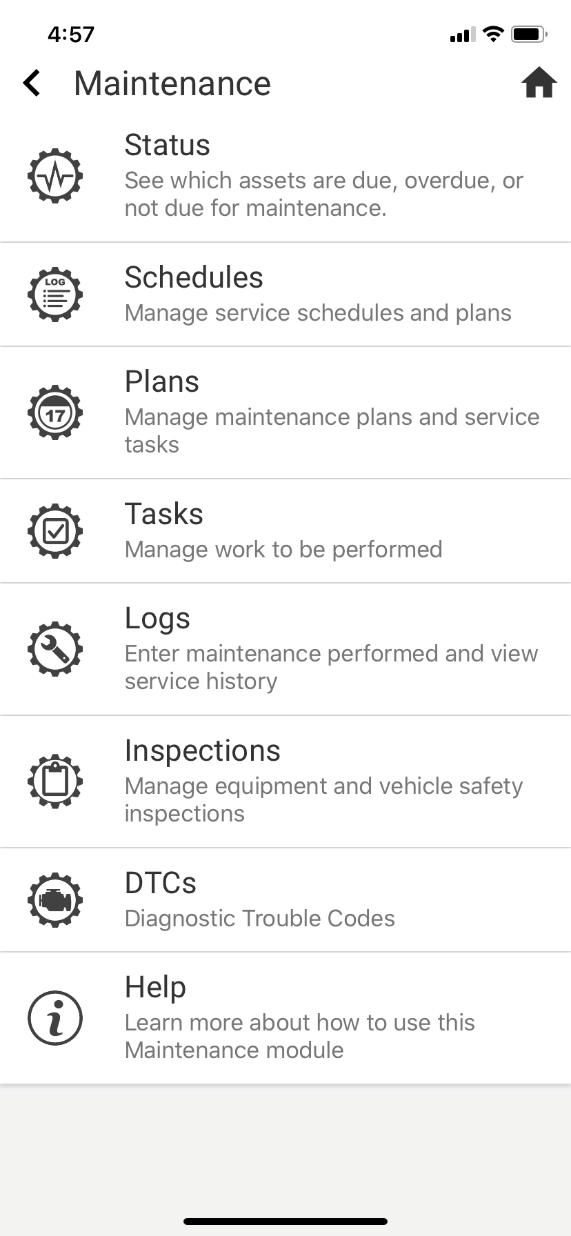
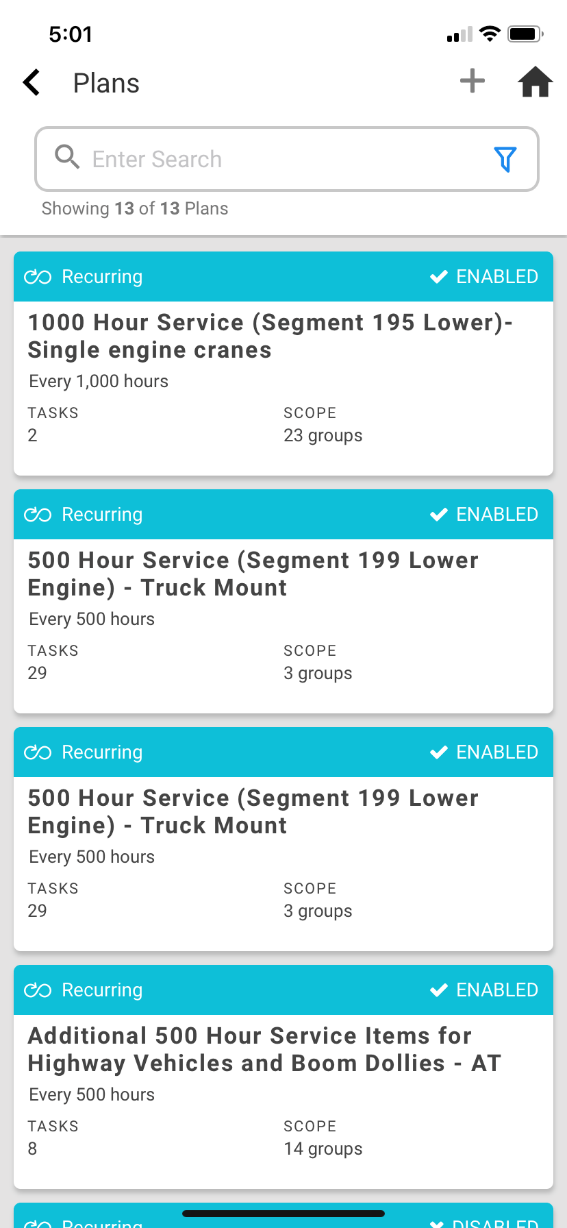
In Temeda Phone App v 2.5.5 we’ve added the ability to Add, Edit, and Delete Maintenance Plans. Now every feature within our Maintenance module that is on the web portal, is now available on the phone.
| Maintenance Home Screen | Plans List Screen |
 |
 |
| Add New Plan Screen: Interval | Add New Plan Screen: Tasks |
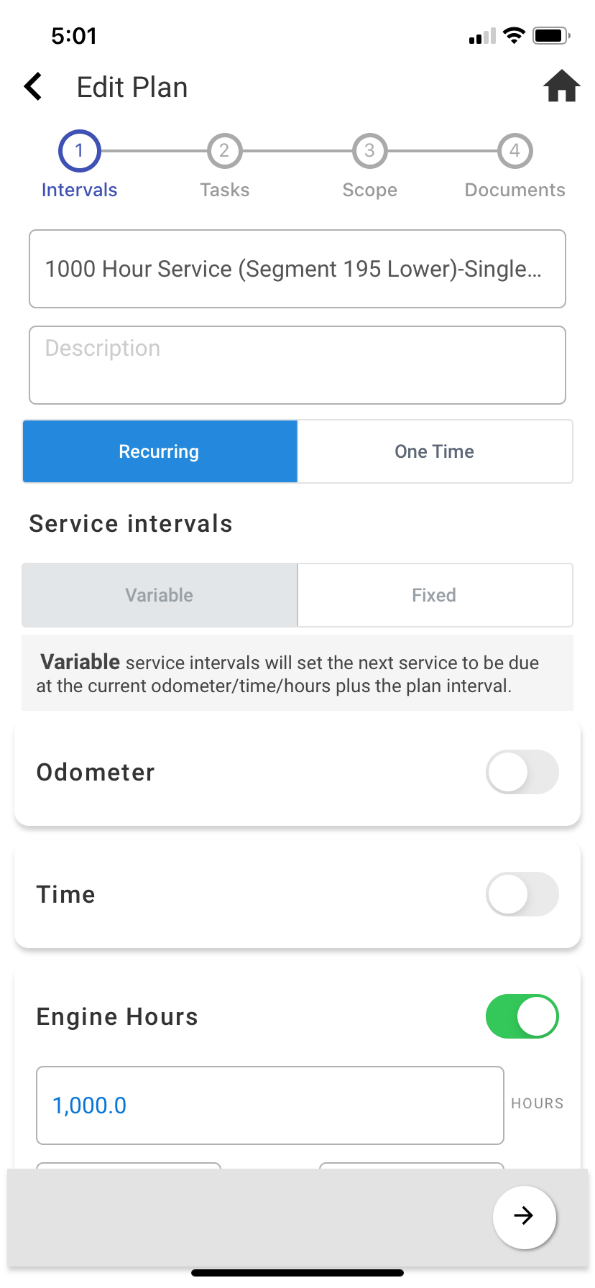 |
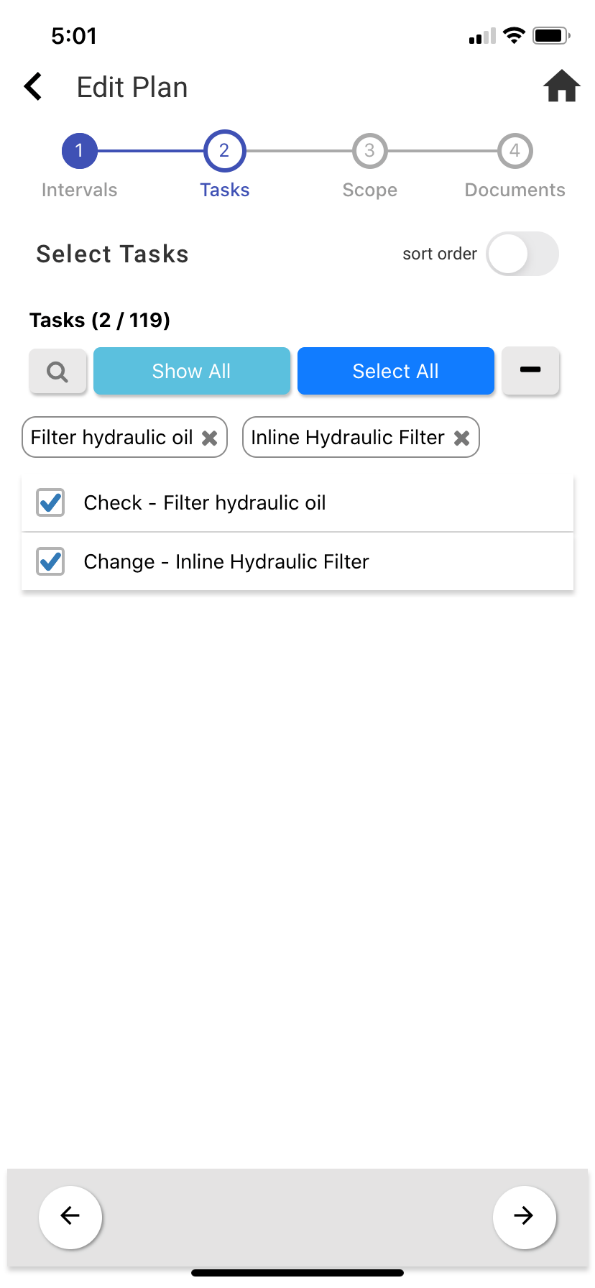 |
| Add New Plan Screen: Scope | Add New Plan Screen: Documents |
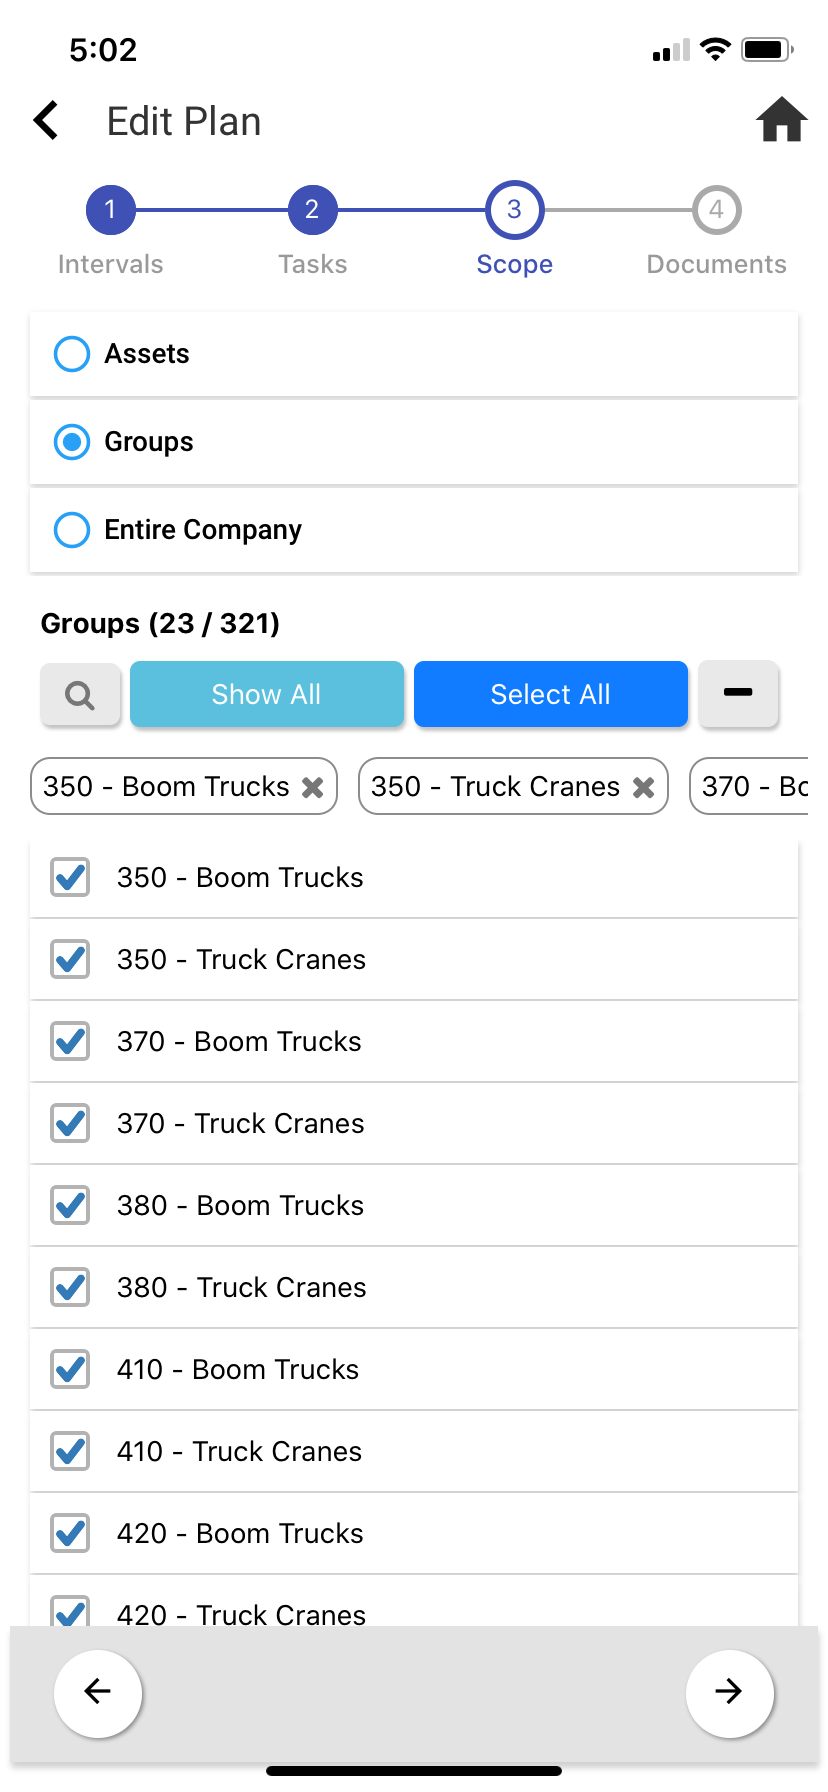 |
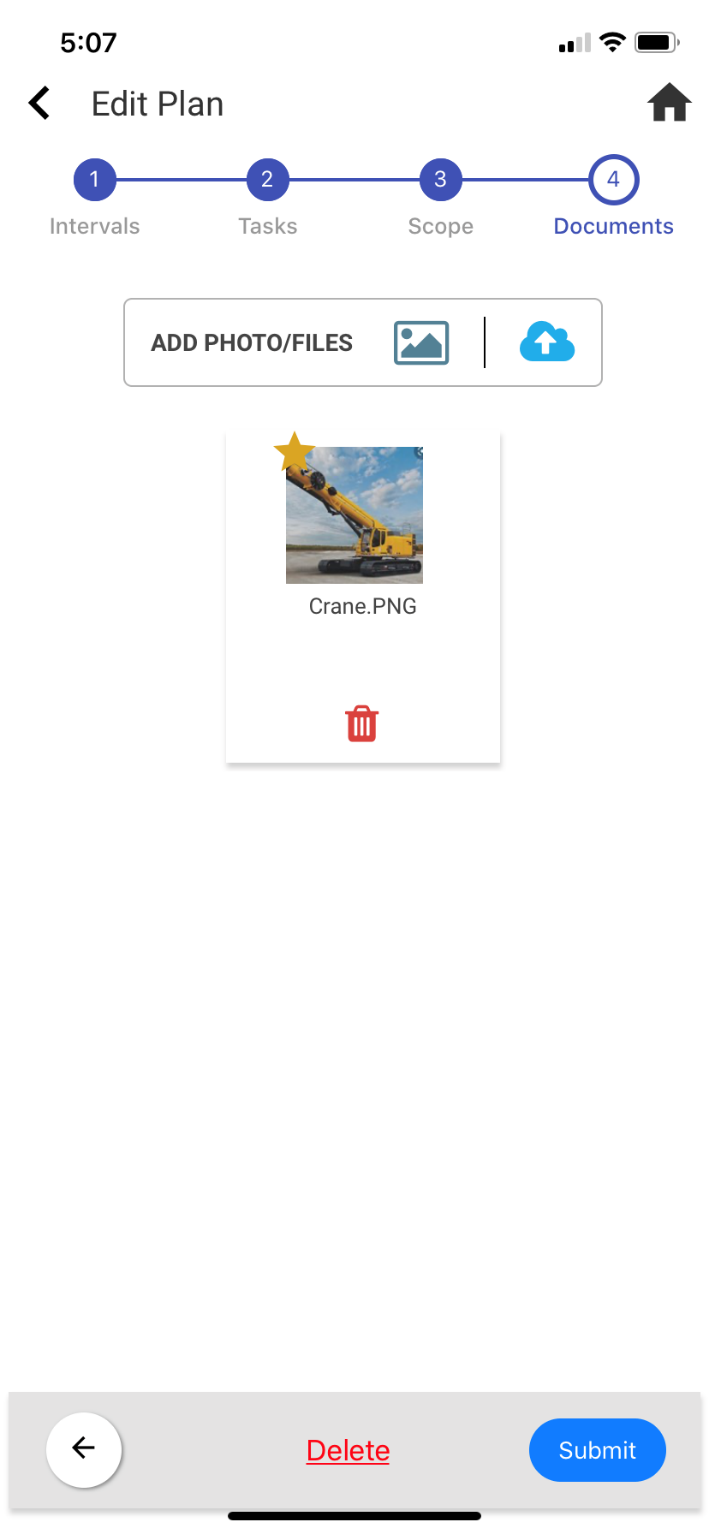 |
