
Release Contents
Temeda is pleased to announce our newest data analytics dashboard, the Maintenance Dashboard! The browser and phone app are part of the 2.57 release.
Introducing the Maintenance Dashboard
The Maintenance Dashboard provides a quick visualization of the key maintenance service metrics for your assets, machinery, and equipment. The new Maintenance Dashboards include key metrics and charts pertaining to:
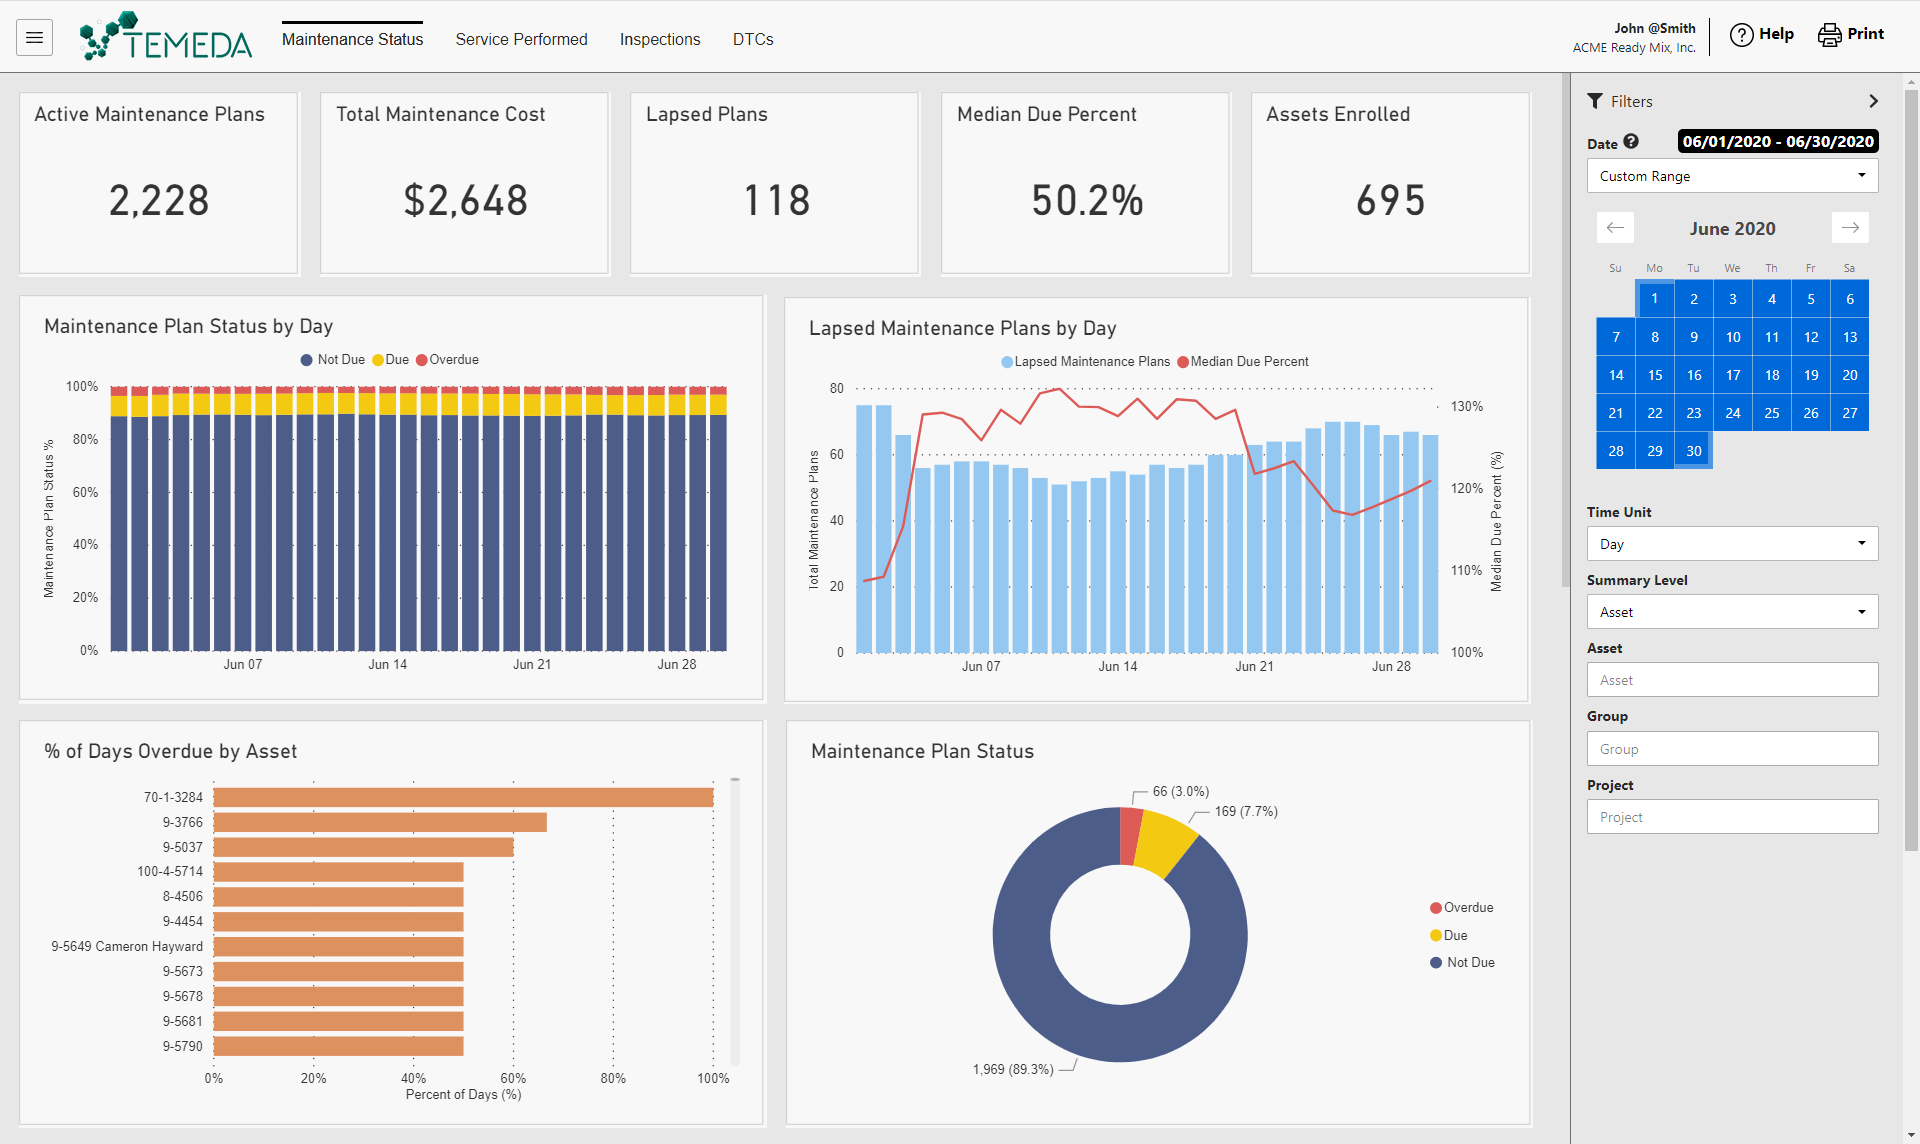
- Maintenance Status – Key metrics around the service health of your fleet and your ability to perform preventive maintenance.
- Service Performed – A breakdown of services logged, parts and labor costs, and planned vs. unplanned maintenance.
- Inspections – A breakdown of vehicle inspections, pass vs. fail rates, inspection times and corrective repairs completed.
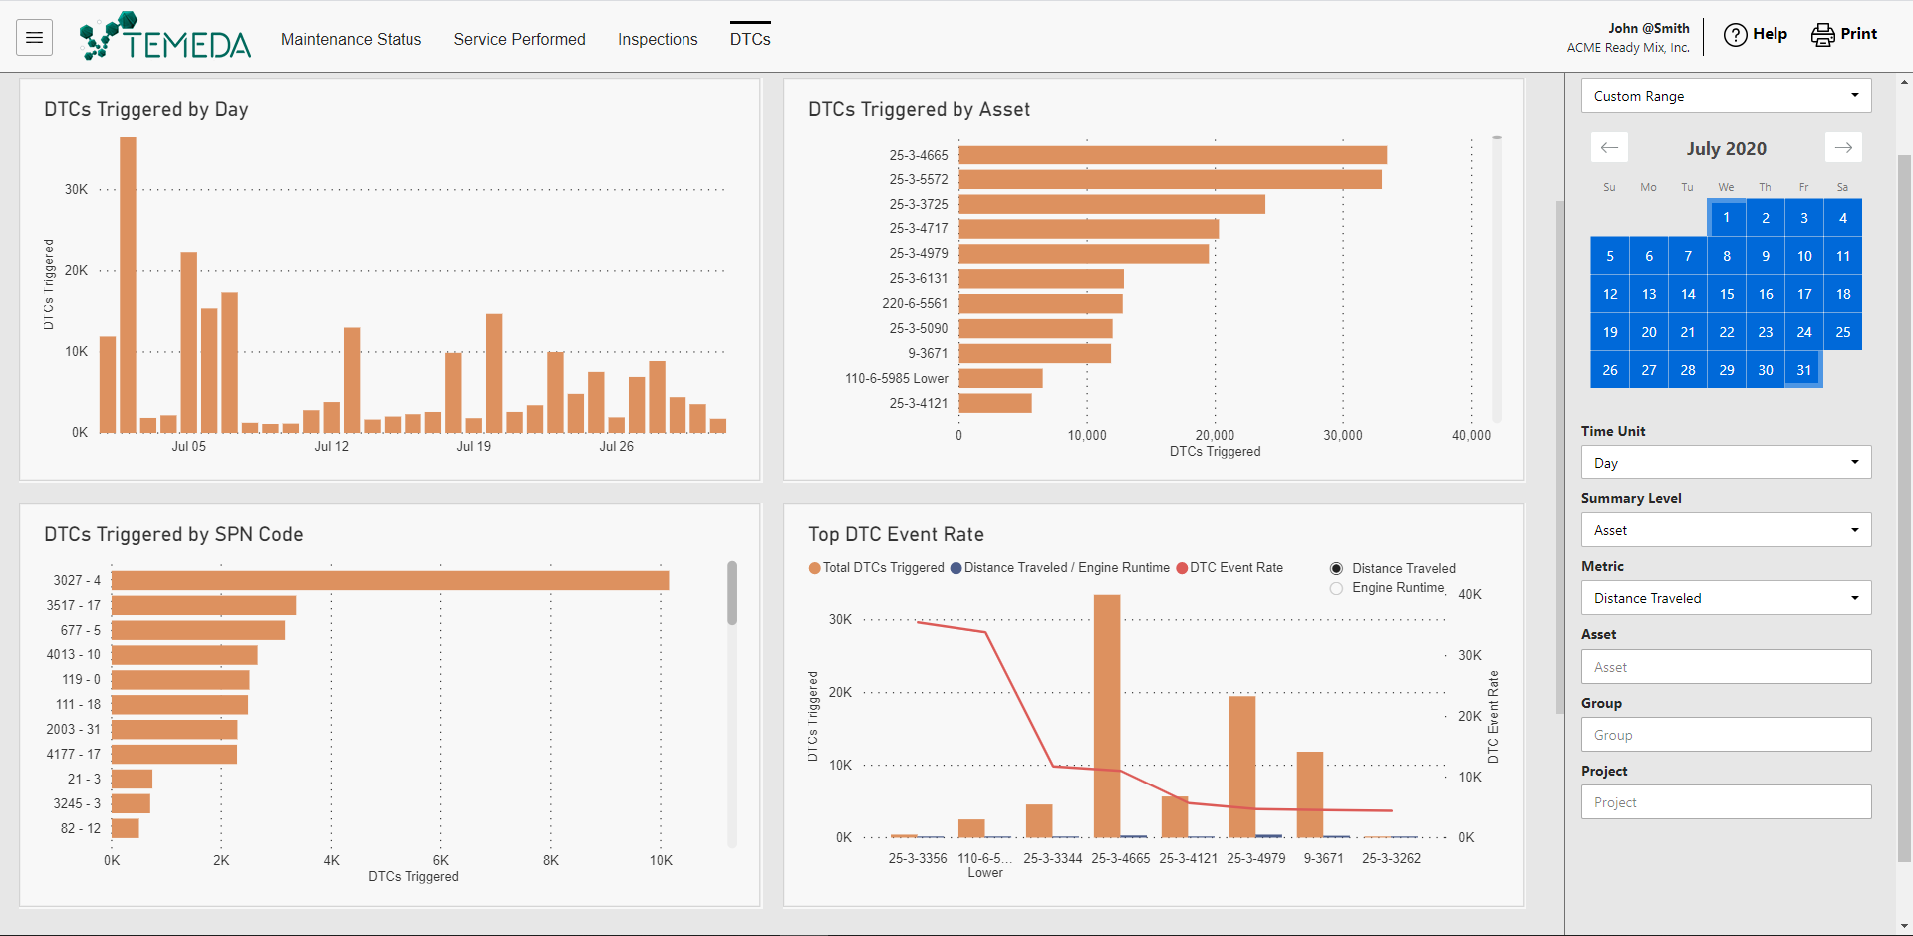
- DTCs – A breakdown of the diagnostic trouble codes, DTC event rates, Assets with engine issues, and SPN/FMI codes.
Service managers in your company can now get a high-level overview of the maintenance department, with a simple visual display to analyze maintenance productivity, identify trends, track parts and labor costs, and see where improvements can be made to operate more effectively.
Want to learn more? Read all about the Maintenance Dashboard in our Help Center.
Maintenance Status
Service Performed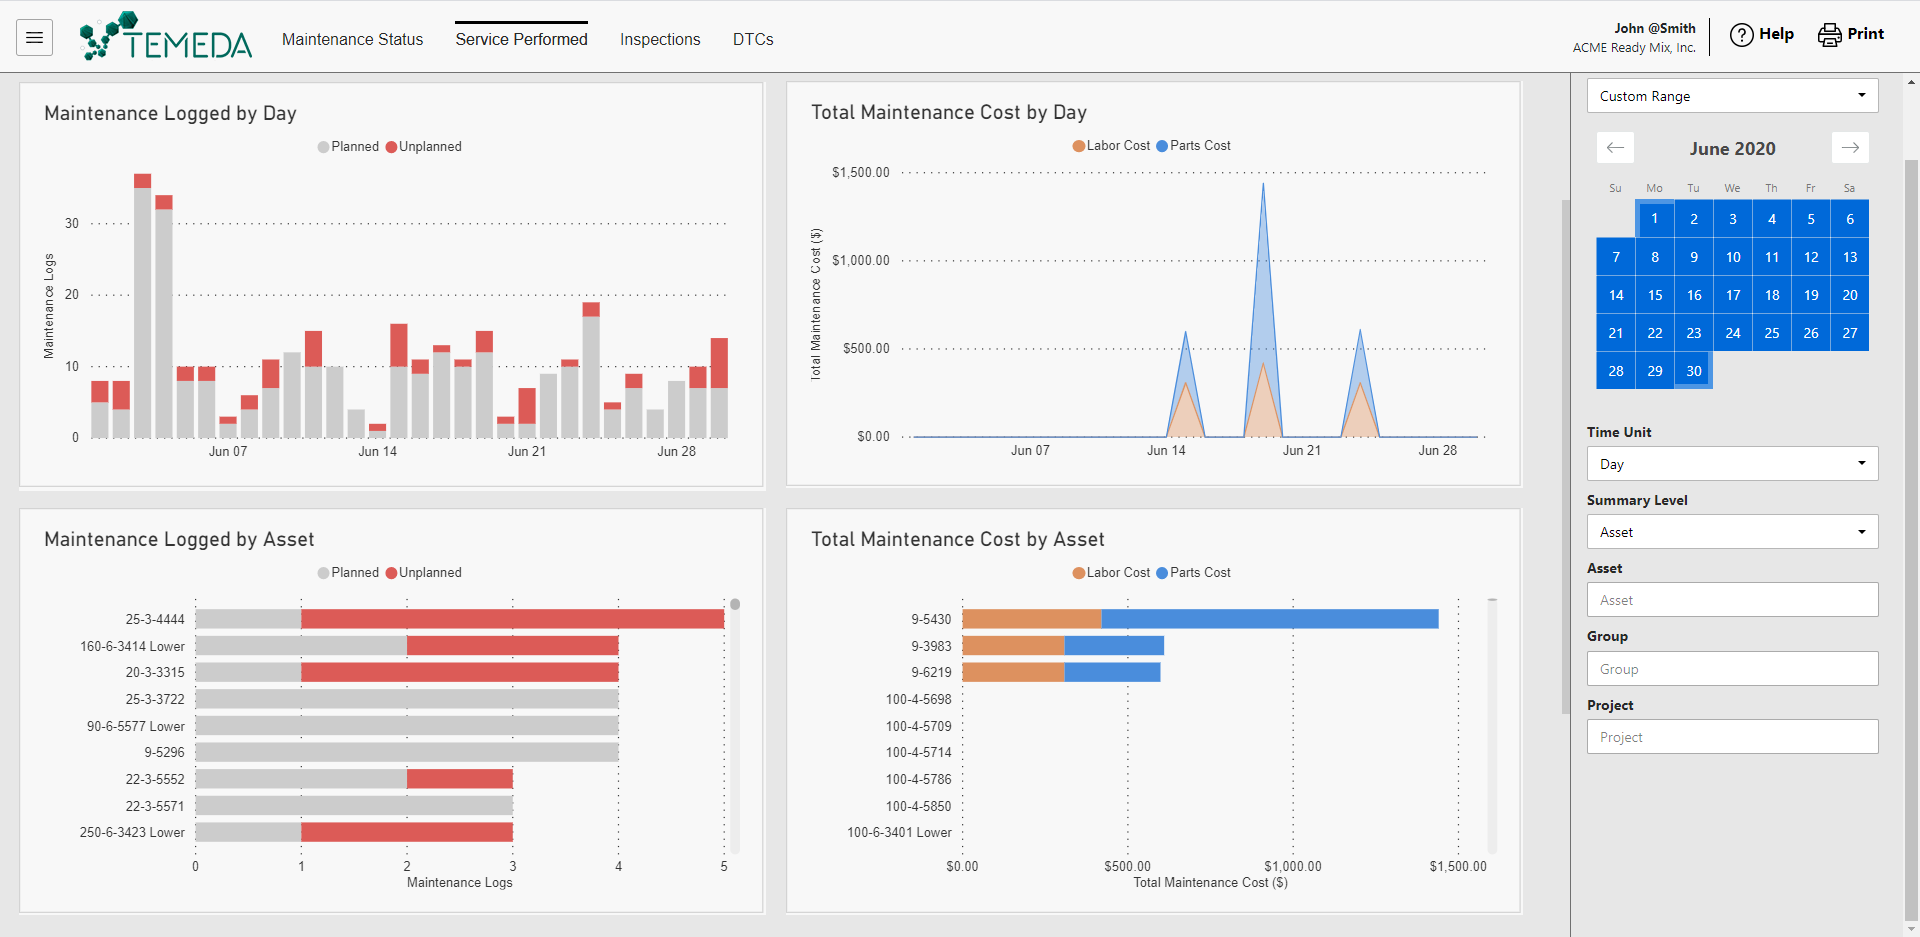
Inspections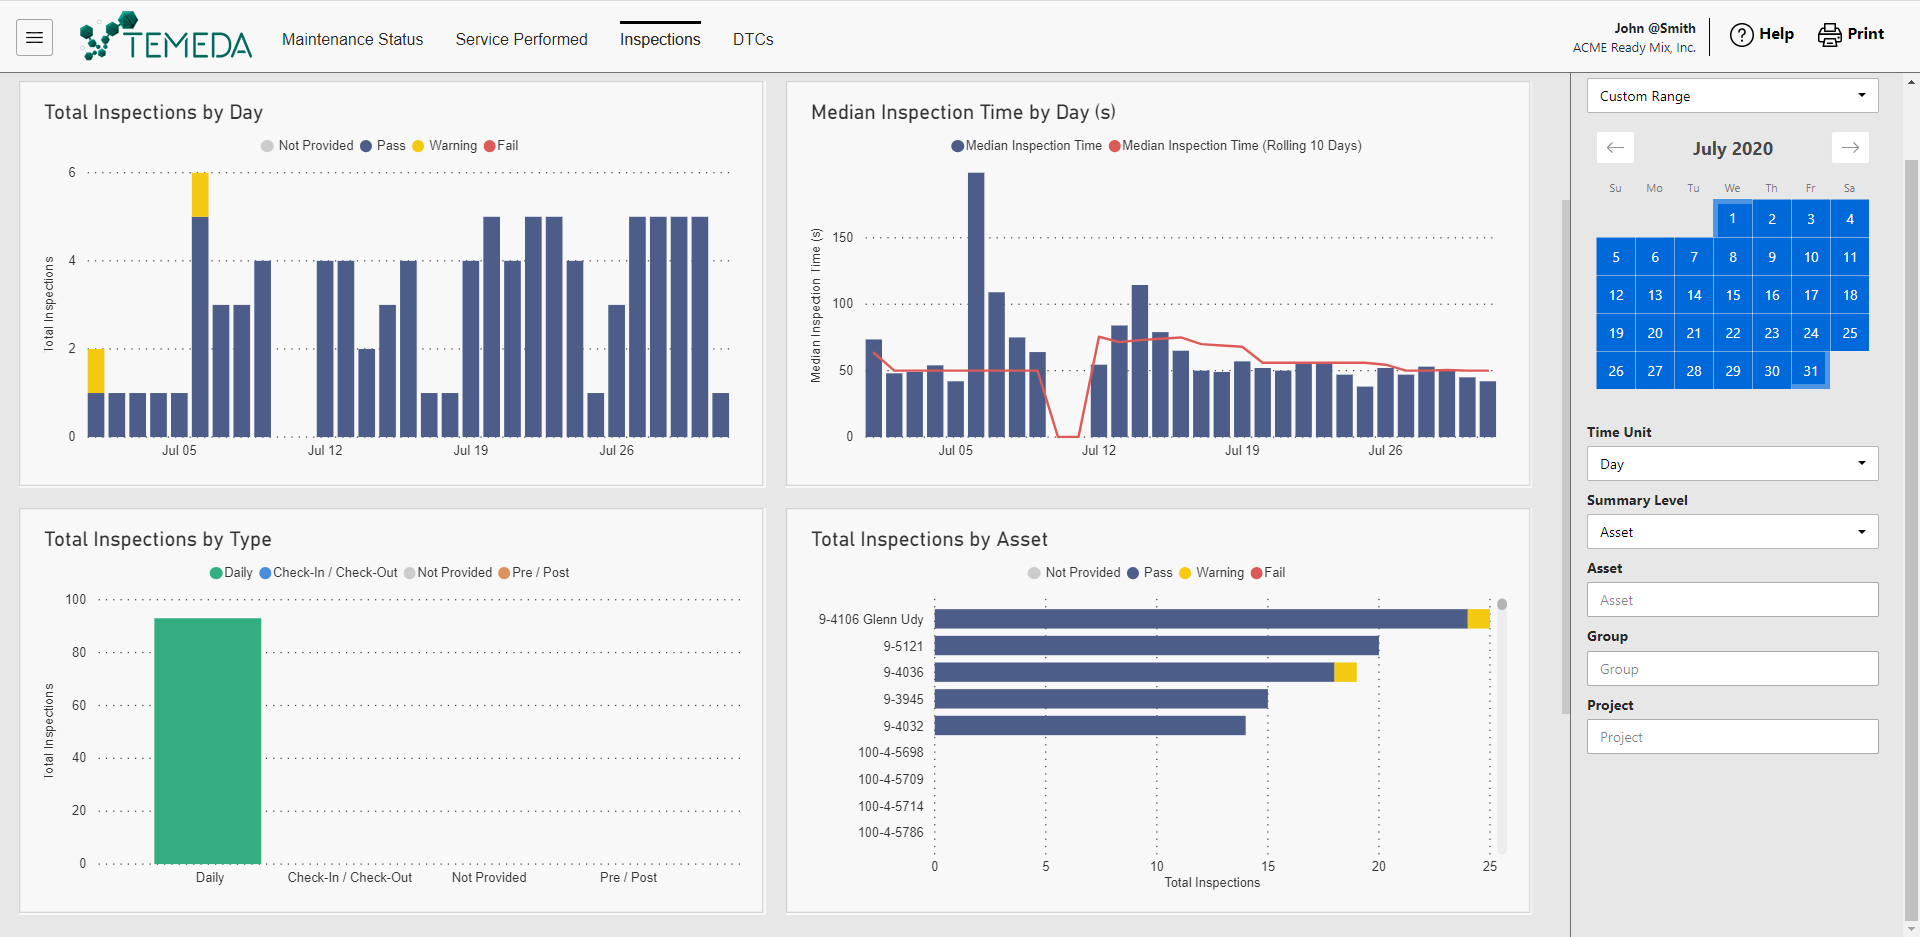
Can you answer these questions about your Maintenance Department?
With Temeda’s Maintenance Dashboard, you can get deep insights into any aspect of your service department.
- How many vehicles have we serviced this month? Is it more than last month?
- How much money have we spent on service parts this year?
- What percent of my fleet is behind on maintenance?
- What Make/Model requires the most maintenance?
- How many services this year were planned vs. unplanned?
- How much are labor costs affecting my bottom line?
- What Make/Model is the most expensive to maintain?
- How long does my equipment continue to run out in the field after it’s due for maintenance?
- Which vehicle in my fleet is the most expensive to keep running?
- How many services do we perform on an average day, week, or month?
- How many vehicle inspections do we conduct each month?
- How many inspections fail, and have we completed the repairs on-time?
- How much time do my operators spend conducting vehicle inspections?
- How often do we see Check Engine Light issues?
- What is causing our most common DTC events?
- Which Make/Models have the most engine issues?
- Is our current staff of maintenance technicians appropriate for our service needs?
Maintenance Dashboard – Key Metrics Definitions:
- Active Maintenance Plans: The number of active Maintenance Plans and associated Assets for the selected date range.
- Total Maintenance Cost: The total maintenance costs (parts + labor) for all service completed in the selected date range.
- Lapsed Plans: The number of maintenance plans that have gone overdue in the selected date range.
- Median Due Percent: The median due percent for all maintenance plans in the selected date range.
- Assets Enrolled: The number of assets enrolled in maintenance plans for the selected date range.
- Maintenance Logged: The number of maintenance logs with a completed service date in the selected date range.
- Overdue Service %: The percentage of logged service which was overdue in the selected date range.
- Assets Serviced: The number of assets serviced with a completed service date in the selected date range.
- Unplanned Service %: The percentage of logged service that was unplanned in the selected date range.
- Total Inspections: The number of inspections completed in the selected date range.
- Failed Inspections: The number of failed inspections completed in the selected date range.
- Repairs Completed: The number of inspections with completed corrective actions in the selected date range.
- Median Inspection Time (s): The median inspection time in seconds (time it took to inspect a vehicle) for all inspections completed in the selected date range.
- Total Inspection Time (hr): The total inspection time in hours for all inspections (time it took to inspect a vehicle) completed in the selected date range.
- DTCs Triggered: The number of Diagnostic Trouble Codes triggered in the selected date range.
- Unique SPNs: The number of unique Suspect Parameter Numbers for all DTCs triggered in the selected date range.
- DTC Events per Asset: The average number of Diagnostic Trouble Codes triggered per Asset for the selected date range.
- DTC Events per Day: The average number of Diagnostic Trouble Codes triggered per day for the selected date range – DTC Event Rate can be determined using 2 different calculations: DTCs per 100 miles or DTCs per Hour of Engine Runtime.
