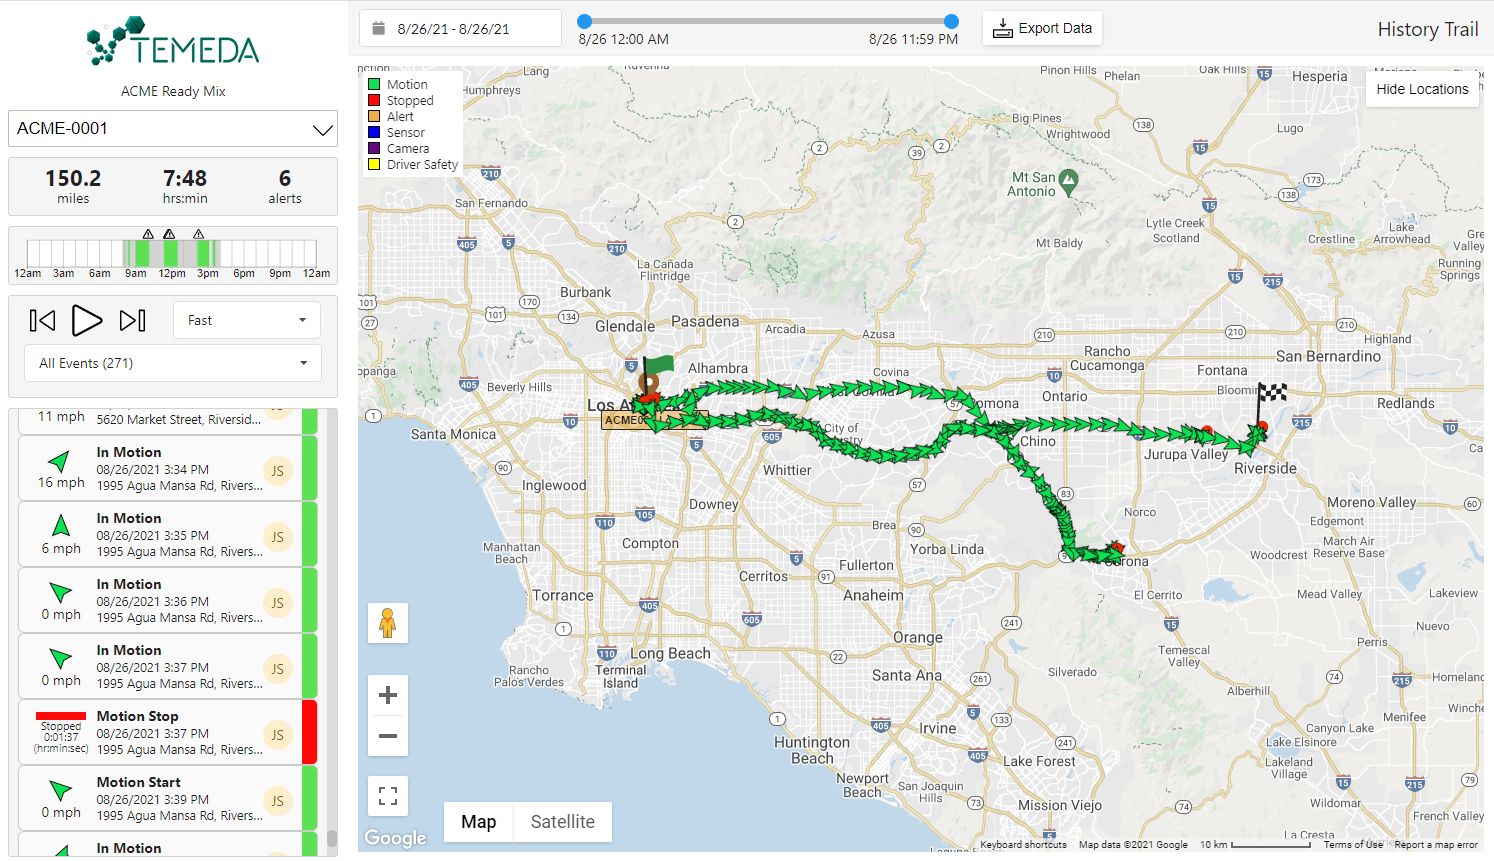
Enhanced History Trail
In Temeda platform v2.66 we’ve enhanced the user experience for our History Trail feature. History Trail allows you to visualize the routes, events, and alerts of your drivers and fleet. By selecting an asset and a timeframe, you can re-trace each step of any asset on the map and view pertinent information such as distance driven, engine run time, alerts, speed, stops, camera events, driver, and driver behavior.
The enhanced History Trail page.
What’s New?
- A quick prominent display of miles driven, engine runtime hours and minutes, and the total number of alerts for the selected asset and timeframe.
- A new 24-hour timeline chart to visualize the asset activity throughout the day. The chart will show you when the asset was active and moving versus idle or off. Above the timeline a new alert icon will display when alerts were triggered. You can hover over the timeline to view information about moving, idle or engine off status. Clicking on the timeline will cause the event history tiles to zoom to the point in time where you clicked.
- Event filter now shows the number of events for each event type.
- Event history tiles have been redesigned for better readability.
- A new Export Data button will allow you to export the underlying history trail data into excel.
- Hovering over the driver initials will display the driver’s full name.

