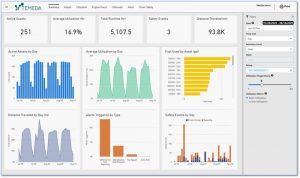
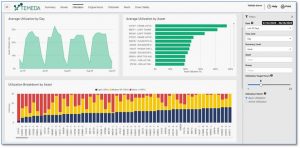
Temeda is proud to release our newest feature: Dashboards. This first Dashboard release contains the Fleet Overview dataset, so you can get a birds-eye view of all your assets.
Temeda has been hard at work designing the next step in Heavy Industrial Telematics. The Dashboard is designed to improve the operations of Heavy Industrial Equipment owners and operators by guiding better decision making and enhancing accountability with the use of better data.
Your equipment sends mountains of data every day. Inside of this data are the keys to better performance, higher efficiency, and waste reduction. With Dashboards, Temeda is working to present data in new and unique ways that better enable our customers to identify waste, performance improvement opportunities, and key measures that will allow that customer to make and save more money.
These Dashboards will continue to improve over time. In version 1.0, we are building the foundation upon which we will construct increasingly advanced functionality. V1.0 is based on key drivers used in every Heavy Industrial Business, such as Utilization, Driver Safety, and Daily Runtime. Read more about it in our help site documentation.
The Dashboard will be continually augmented and refined as we receive feedback. We envision Dashboard to become so valuable to Industrial IoT customers, that it becomes a central, unbiased tool to measure business operation health. This tool will allow Industrial IoT customers to gauge business performance, identify key trends, identify little issues before they become big issues, enhance accountability, improve safety, monitor costs, monitor revenue, and predict future performance. The flexibility of this tool will allow users to refine and tailor the presentation of this data based on your preferences.
To learn more about the Dashboards, check out our help site.


