In Temeda platform v2.65 we’ve added a new tab named “Reports” to the User Activity Dashboard. The User Activity Dashboard helps customers get a better understanding about user adoption of the Temeda solution throughout their organization. The new Reports tab shows which users are running which reports and how often.
User adoption is the process by which new users become acclimated to a product or service and decide to keep using it.
At Temeda, our objective is to help our customers achieve their goals – whether it’s operating their fleets more efficiently, improving safety, minimizing downtime, maximizing utilization, reducing costs – or any goal where we can help!
The Temeda solution and applications contain a multitude of modules and capabilities that are used by various customers for many different reasons. The User Activity Dashboard gives customers a holistic view of user adoption for the Temeda solution throughout an organization. The User Activity Dashboard will show which users are logging in, which areas of the app get used, which users are not using the app, which users are using the phone app or desktop app, the number and percent of active users, user activity distribution, which reports are being run, and a breakdown of where/when users are most active. As with all of our dashboards, you can select various date ranges, filters, groupings, and drill-down items.
Key Metrics: User Actions
- Total User Actions by Day (Viewed, Created, Updated, Deleted)
- Total User Actions by Type (Map, Assets, Reports, Locations, Maintenance, Inspections, etc.)
- Activity Distribution by Type
- Total Actions by User Email address, User Role, Hierarchy Level
- Activity Breakdown Timeframe
Key Metrics: User Logins
- Active Users %
- User Logins by Day (Web and Mobile)
- Logins by Email address, User Role, Hierarchy Level
- User Login Breakdown
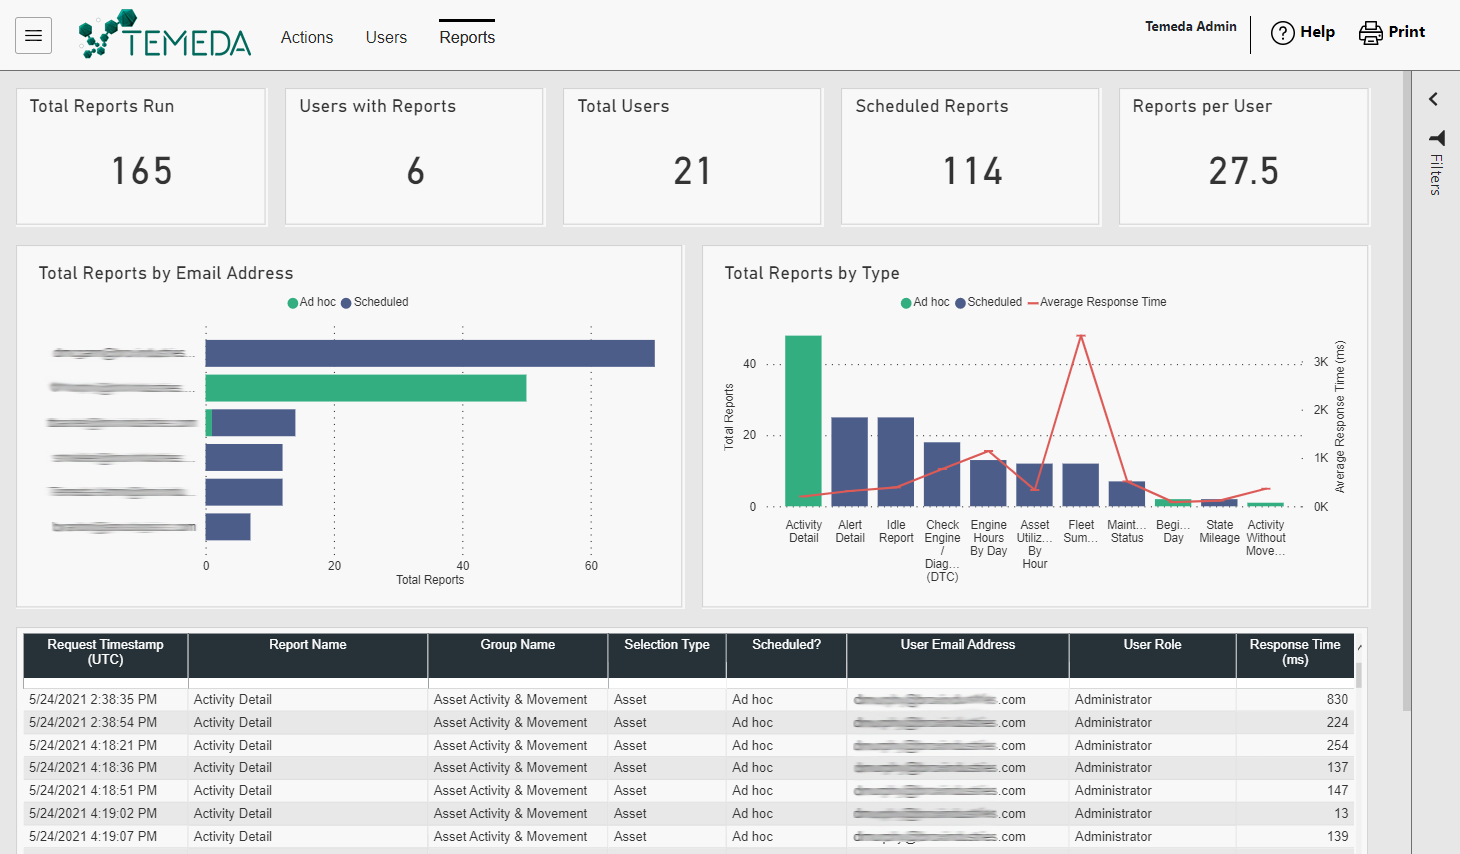
Key Metrics: Reports
- Total Reports run
- Reports Run by User
- Total Reports Run by Type of Report
- Ad hoc vs Scheduled Reports
Dashboard Filters/Groupings:
- Date Range (Last 30 days, Month to Date, Year to Date, etc.)
- Time Unit (Day, Week, Month)
- Summary Level (Email, User Role, API User, Hierarchy Levels)
- Action (All, Viewed, Created, Updated, Deleted)