Release Contents
Release highlights
- Driver History
- Data Field History
- Machine Hours
- Clear Alert Events
- User Activity Report
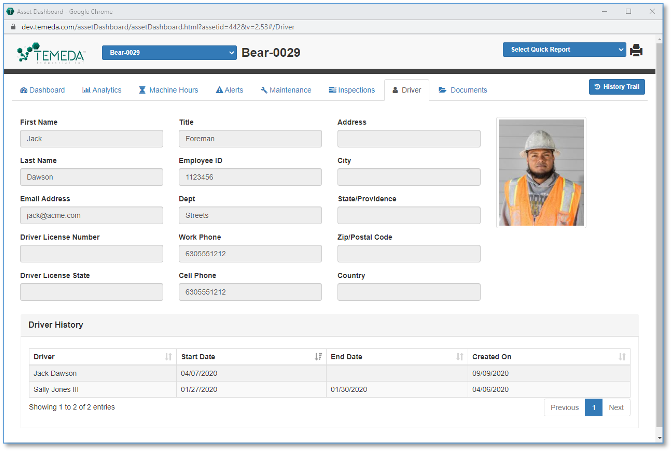
Driver History
In Temeda Web Portal v 2.53 we’ve added Driver History to the Asset Dashboard Driver tab. You can now view the history of all drivers/operators on a particular asset or vehicle. This will help you keep track of who operated which vehicle and when.
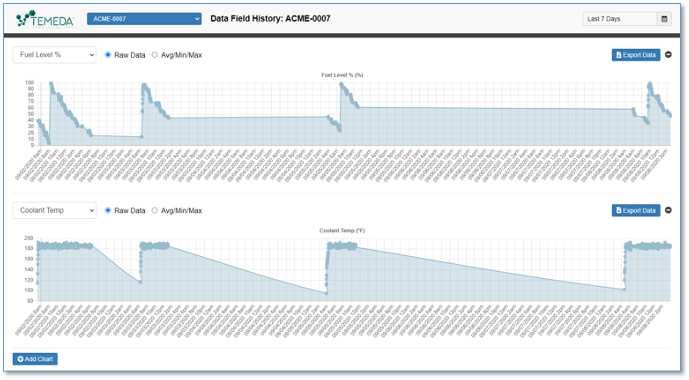
Data Field History
In Temeda Web Portal v 2.53 we’ve added a new feature called Data Field History. This feature allows you to select an individual data field from the Asset Dashboard, and the system will open a new window that charts each message from the telematics device for the selected data field over the last 7 days. You can change the timeframe using the date picker and add additional charts to the page for other data fields.

This feature allows you to quickly drill into a specific field and see what data is being transmitted from the telematics device without having to run a separate report. This can be a useful tool to analyze time-series data from your devices in a graphical chart.
From the Data Field History page, you can select any asset and the charts will refresh the data for the newly selected asset. You can switch from Raw Data view to the Avg/Min/Max view. Also, you can export the data from each chart into an Excel spreadsheet by clicking the Export Data button.
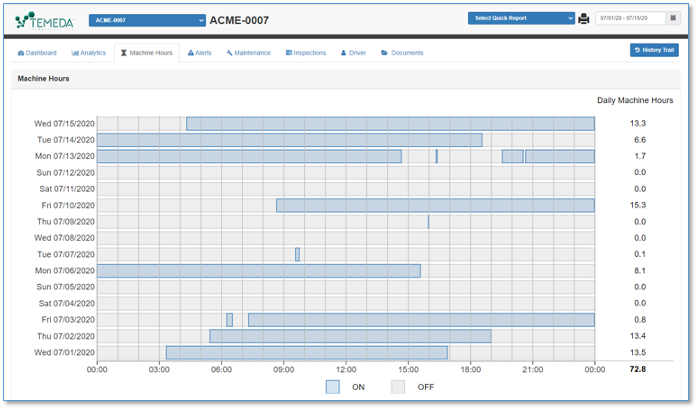
Machine Hours
In Temeda Web Portal v 2.53 we’ve added a new tab on the Asset Dashboard called Machine Hours. The Machine Hours view provides a graphical representation of your asset’s engine hours – from ignition on to ignition off – in a day by day 24-hour calendar matrix display. This is a great way to view not only the total hours by day, but the chart will show you the breakdown of those daily hours in a 24-hour period. The Machine hours tab allows you to use the date picker to change the timeframe, totals the engine hours by day, and provides a grand total for the selected timeframe.
Clear Alert Events
In Temeda Web Portal v 2.53 we’ve added the ability to clear alert events. Events that trigger in your account may have been inadvertent or may have been resolved. The system now allows you to delete or clear out one or more alert events. Administrators can go to the Alert Events menu and select the “Clear” button. This will remove the alert event from the system including reports and history trail.
![]()
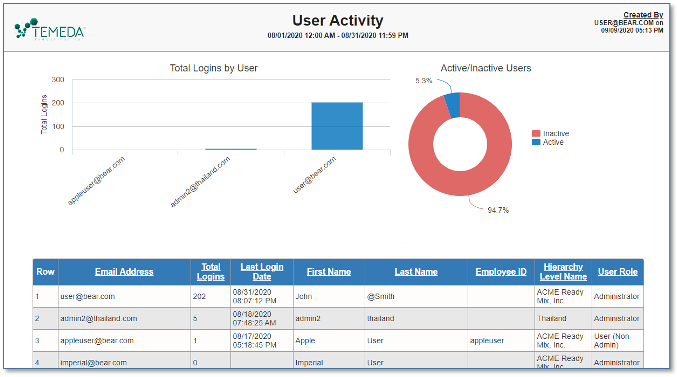
User Activity Report
In Temeda Web Portal v 2.53 we’ve added a new report named “User Activity/Logins”. This report will show you which employees/users are logging into the Temeda App and how often they use it. This is helpful to track user adoption of the system by fleet or equipment managers and other management staff.
The report highlights the most active users, inactive users, and displays all users and their roles and hierarchy assignments within your account/organization.